Related resources
Strengthening data reliability at WGU through smarter governance
Share on:

Managing data at a fully online university presents unique challenges. In a recent episode of Data Citizens Dialogues, Garth Gehlbach, Head of Data Governance at Western Governors University (WGU), described how the university transitioned from fragmented data management to a more structured governance model.
“I have a vivid memory. In my first month at Western Governors University, I was in a meeting, and a C-level executive put a full stop on the meeting. And she proceeded to describe her frustrations… Seeing reports where it had the same metric, but it had different values. And she summarized her frustrations by saying, ‘I can’t trust the data.’ In the subsequent months, I heard that again and again,” Garth recalled.
WGU, with more than 140,000 students enrolled across four colleges—business, IT, teaching and nursing—handles enormous volumes of data. However, the lack of clear ownership and structure led to inconsistent reports and misaligned metrics. Garth highlighted that issues stemmed from limited visibility into their data landscape, including uncertainty about existing data, its location, ownership and how it moved between systems.
Why context matters in data governance
WGU’s data governance journey exposed a familiar challenge—lack of visibility into data creates confusion and mistrust. Without a clear source of truth, teams struggled to locate and trust data. “Before we had the data governance initiative, it was a scramble for data. Some of my colleagues at Ohio State put a good term on it—it was trick-or-treating for data,” Garth recalled.
The solution involved linking data to familiar business terms and processes, recognizing that context plays a crucial role. Garth pointed out that data consumers often lack technical expertise and rely on clear, relevant context to interpret and apply the information effectively.
Defining the data context graph
To address these challenges, WGU developed what Garth refers to as the Data Context Graph—a framework that connects data assets to relevant business processes. “It became very clear that we needed a single source of truth for our enterprise metadata,” he explained.
Garth compared the Data Context Graph to LinkedIn’s professional network. “Similar to a professional graph or a social graph, the data context graph connects data to contextual information,” he said. “Most of us go to LinkedIn. What experience, skills, interests do you have? Let’s match that up with some of these job descriptions,” he added.
By tying data to business terms and initiatives, WGU developed a system that enables users to easily locate and interpret relevant information. Garth noted that this approach provides users with immediate visibility into the broader context once they access the data, enhancing clarity and decision-making.
How to build a data context graph
Building the Data Context Graph at WGU began with identifying core data assets. “Before we embarked on our data governance initiative, we were early in the implementation of a data lake. And that experience really revealed our lack of visibility and lack of understanding of our data. We suffered from problems of not knowing what data we had,” Garth explained.
Mapping data flow across systems was the next priority. To consolidate this knowledge, WGU integrated information into a central repository. “Having a central repository of this information about data enabled us to solve other problems, to manage a logical enterprise data model to handle master data management, reference data, a whole host of other things,” he noted.
Tools and technologies that support the process
A foundational element of WGU’s Data Context Graph is Collibra’s data catalog, which serves as the backbone for managing metadata. “We have a data catalog. And you’ve got to feed it, right? You’ve got to be able to establish all of this. And one of the critical characteristics of that repository is that it’s got a flexible meta model,” Garth explained.
This flexibility gave WGU the ability to adapt the catalog as their needs evolved. Garth highlighted that the system could easily accommodate new data points, attributes, and relationships, allowing them to capture both key information and the surrounding context that mattered most.
Beyond cataloging, Collibra’s tools make interacting with data more intuitive. “You can search, you can filter, and some of my new favorites are, you can also set notifications,” Garth noted.
The future of data governance
WGU’s experience shows how adding context to your data governance can change the way you manage and trust your data. When prioritizing policies, responsible use and data quality, you create a clearer, more reliable data environment.
As Garth noted, this kind of transformation takes intentional investment in interconnected metadata. But with the right focus, you can build a system where your data is easy to find and also aligned with your business objectives.
***
Garth Gehlbach is the Head of Data Governance at Western Governors University (WGU), where he spearheads initiatives to enhance data transparency and trust across the institution. His efforts focus on creating a self-service data environment by implementing governance frameworks like the Data Context Graph, enabling analysts to find, understand and responsibly use data.
This article is based on an interview between Garth Gehlbach and Thomas Brence, host of Collibra’s Data Citizens Dialogues podcast and Head of Portfolio Marketing at Collibra.
-

Collibra
Collibra
Enterprise AI Control Plane
Share on:
Related articles
Data GovernanceFebruary 14, 2025
Why we are the data and AI leader for you
Data GovernanceJuly 28, 2025
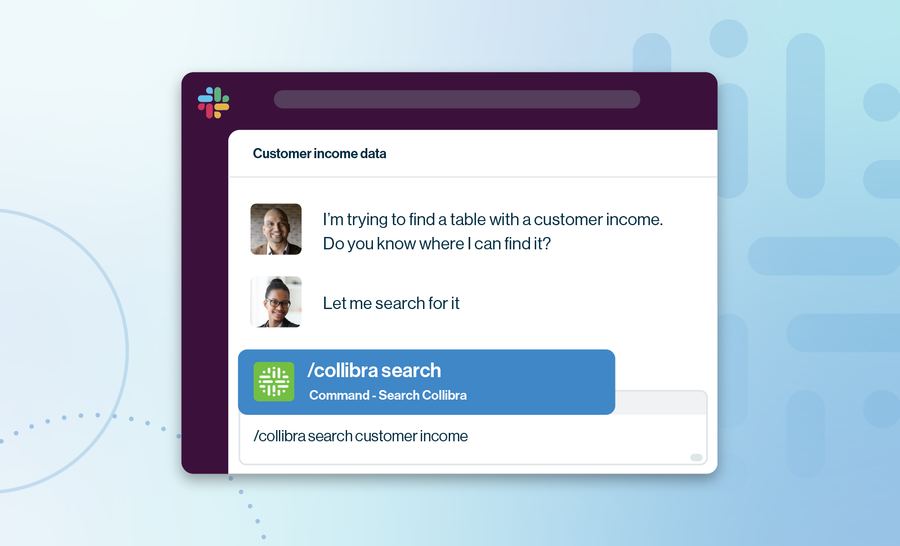
Your new shortcut to trusted data: Collibra’s two-way Slack Integration

Data GovernanceMay 24, 2022
The journey to data catalog and governance success: A customer perspective

Data GovernanceOctober 12, 2023
Improved user provisioning leads to calmer seas and smoother sailing
Keep up with the latest from Collibra
I would like to get updates about the latest Collibra content, events and more.
Thanks for signing up
You'll begin receiving educational materials and invitations to network with our community soon.