Poor data can be a challenge. As a result, organizations are heavily investing in data quality solutions. Gartner predicts that by 2025, 60% of data quality processes will be autonomously embedded and integrated into critical business workflows. This assessment highlights the critical role data quality plays in business.
Data quality indicates if data is fit for use to drive trusted business decisions. Traditionally, data quality measurements rely on quality dimensions, but that snapshot approach does not provide actionable insights. The limited scope of dimensions gets further diluted by the fact that they often overlap and create conflict in the shared understanding.
Standard data quality dimensions fail to consider the business impact, which is crucial for any organization. Gartner notes this issue, suggesting that the dimensions need an overhaul from the perspective of data consumers.
Collibra agrees with this, and therefore, focuses on the 9 dimensions of data quality that have a meaningful business impact. Behavior is the key dimension here, monitoring if the data behaves or looks different from the way before. This is where the concept of data observability comes into the picture.
Discover how Collibra is helping Equifax achieve digital transformation goals with a seamless, centralized data fabric platform.
Hear from Peter Vennel at Equifax and read their customer story now.
What is data observability?
So what is data observability? It observes data as it moves through the enterprise systems and ensures quality across the entire data journey. How does data observability do that? It uses a number of tools to constantly monitor a wide range of parameters, helping understand what is happening to data and why.
Forbes defines data observability as a set of tools to track the health of enterprise data systems. The set of tools leverages several technologies to help identify and troubleshoot problems when things go wrong.
Data Observability takes a broader view of data, including its lineage, context, business impact, performance, and quality. The five pillars of data observability include volume or completeness, the freshness of data, distribution indicating the validity of values, schema, and lineage.
Why data observability matters
Traditional data quality focuses on fixing the data issues in a reactive manner. While it scans the data sets, it may miss out on the entire data journey across the enterprise. Data observability, on the other hand, provides the capability to diagnose the end-to-end data value chain. It proactively tracks the health of enterprise data systems, so that you are aware of potential issues in advance.
The state of data quality in the 2020 O’Reilly survey marks the top issue as too many data sources, too little consistency. Reconciling data across several diverse sources is challenging. Moreover, maintaining data consistency at the rate data arrives and gets consumed today is not easy. Data observability steps in there to manage data quality at scale.
Data observability helps detect anomalies before they can affect the downstream applications. It leverages metadata for adding context around what is happening and what are its consequences. As downtime costs can go spiraling to more than USD 5,600 per minute, the need for proactive control of downtime is assuming greater importance. Utilizing data lineage, time series analysis and cross-metric anomaly detection, data observability can find and fix the root causes to reduce data downtime.
In summary, data observability:
- Tracks the health of enterprise data systems
- Supports diagnosing the end-to-end data value chain
- Enables managing data quality at scale
- Minimizes data downtime
- Ensures rapid access to trusted data
What distinguishes data observability from data quality
Data observability differs from traditional data quality on several key points.
Data observability empowers DataOps and data engineers to follow the path of data, move upstream from the point of failure, determine the root cause, and help fix it at the source.
| Key Area | Traditional Data Quality | Data Observability |
| Scope for scanning and remediation | Datasets | Datasets (data at rest), Data pipelines (data in motion) |
| Focus | Correcting errors in data | Reducing the cost of rework, remediation, and data downtime by observing data, data pipelines, and event streams |
| Approach | Finding ‘known’ issues | Detecting ‘unknown’ issues |
| Rules and metrics | Manual static rules and metrics | ML-generated adaptive rules and metrics |
| Root cause investigation | No | Through data lineage, time series analysis, and cross-metric anomaly detection |
| Key persons | Data stewards, Business analysts | Data engineers, DataOps engineers |
| Common use cases | Trusted reporting, compliance [Downstream] | Anomaly detection, pipeline monitoring, data integration [Upstream] |
Add observability to your data quality stack
If you are already using any data quality tools, begin by asking if they are really enabling you to achieve end-to-end quality. Most tools provide only partial automation and limited scalability. Their support for root cause analysis and workflows is also not adequate.
A mature approach to rules leverages ML to make them explainable and shareable. As a result, data quality operators do not need to rewrite rules when data moves across different environments. They can then efficiently manage migration and scaling. The ease of sharing rules across different systems frees business users from worrying about coding languages.
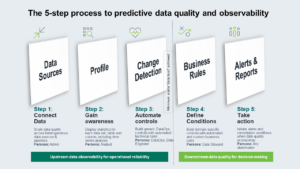
| The 5-step process to predictive data quality and observability | |
| Step 1. Connect data
Persona involved: Admin |
Connect and scan a wide range of heterogeneous data sources and pipelines, including files and streaming data. |
| Step 2. Gain awareness
Persona involved: Any stakeholder |
Display profiling statistics for each data set, table, and column, including hidden relationships and time series analysis. |
| Step 3. Automate controls
Persona involved: DataOps |
Build generic DataOps and statistical controls with automated technical rules to detect unknown issues and scale your data quality operations.
Examples of technical rules: Did my data load on time? Is my data complete? Does my data fall into normal ranges? |
| Step 4. Define conditions
Persona involved: Data steward |
Build domain-specific controls with automated and custom business rules that are adaptive, non-proprietary, explainable, and shareable.
Examples of business rules: Do my trades roll up into my positions? Did the bank loan get approved for the correct interest rate? Does this insurance customer have a home and auto policy? |
| Step 5. Take action
Persona involved: Any stakeholder |
Embed data quality processes into critical business workflows. Initiate alerts with the right data owners when data quality scores drop, to resolve issues quickly. |
A unified data management approach with full-suite data quality and observability capabilities
Enabling business users to identify and assign quality issues ensures that data quality efforts come from the entire enterprise and are not limited to a small team. Leveraging metadata augments this approach by giving the right context to the quality issues for impact assessment.
| Gain proactive data intelligence about | |
| Data quality + observability + data catalog | What data sets or columns you should scan first |
| Data quality + observability + data lineage | What data issues you should resolve first to address the root causes |
| Data quality + observability + data governance | What data issues you should resolve first to address the root causes |
A unified data management approach works with data quality, observability, catalog, governance, and lineage together. It helps you centralize and automate data quality workflows to support a holistic view of managing data and get the best out of your data and analytics investments.


